Ayla Pamukcu is a Postdoctoral Research Associate at Brown University. As a volcanic petrologist, she is a wide array of tools to investigate how, when, where, and why volcanic eruptions occur with particular interest in supereruptions. You can read more about her research here.
I study volcanoes, but I haven’t seen too many live ones. That’s partly because most of my work is focused on supereruptions – giant volcanic eruptions the likes of which haven’t been witnessed by humans, at least not within recorded history. As a frame of reference, the kinds of volcanoes we are used to seeing erupt, like Etna or Mount St. Helens, produce something on the order of 1 km3 of magma in an eruption. A supereruption, on the other hand, involves 100s-1000s of km3 of magma.
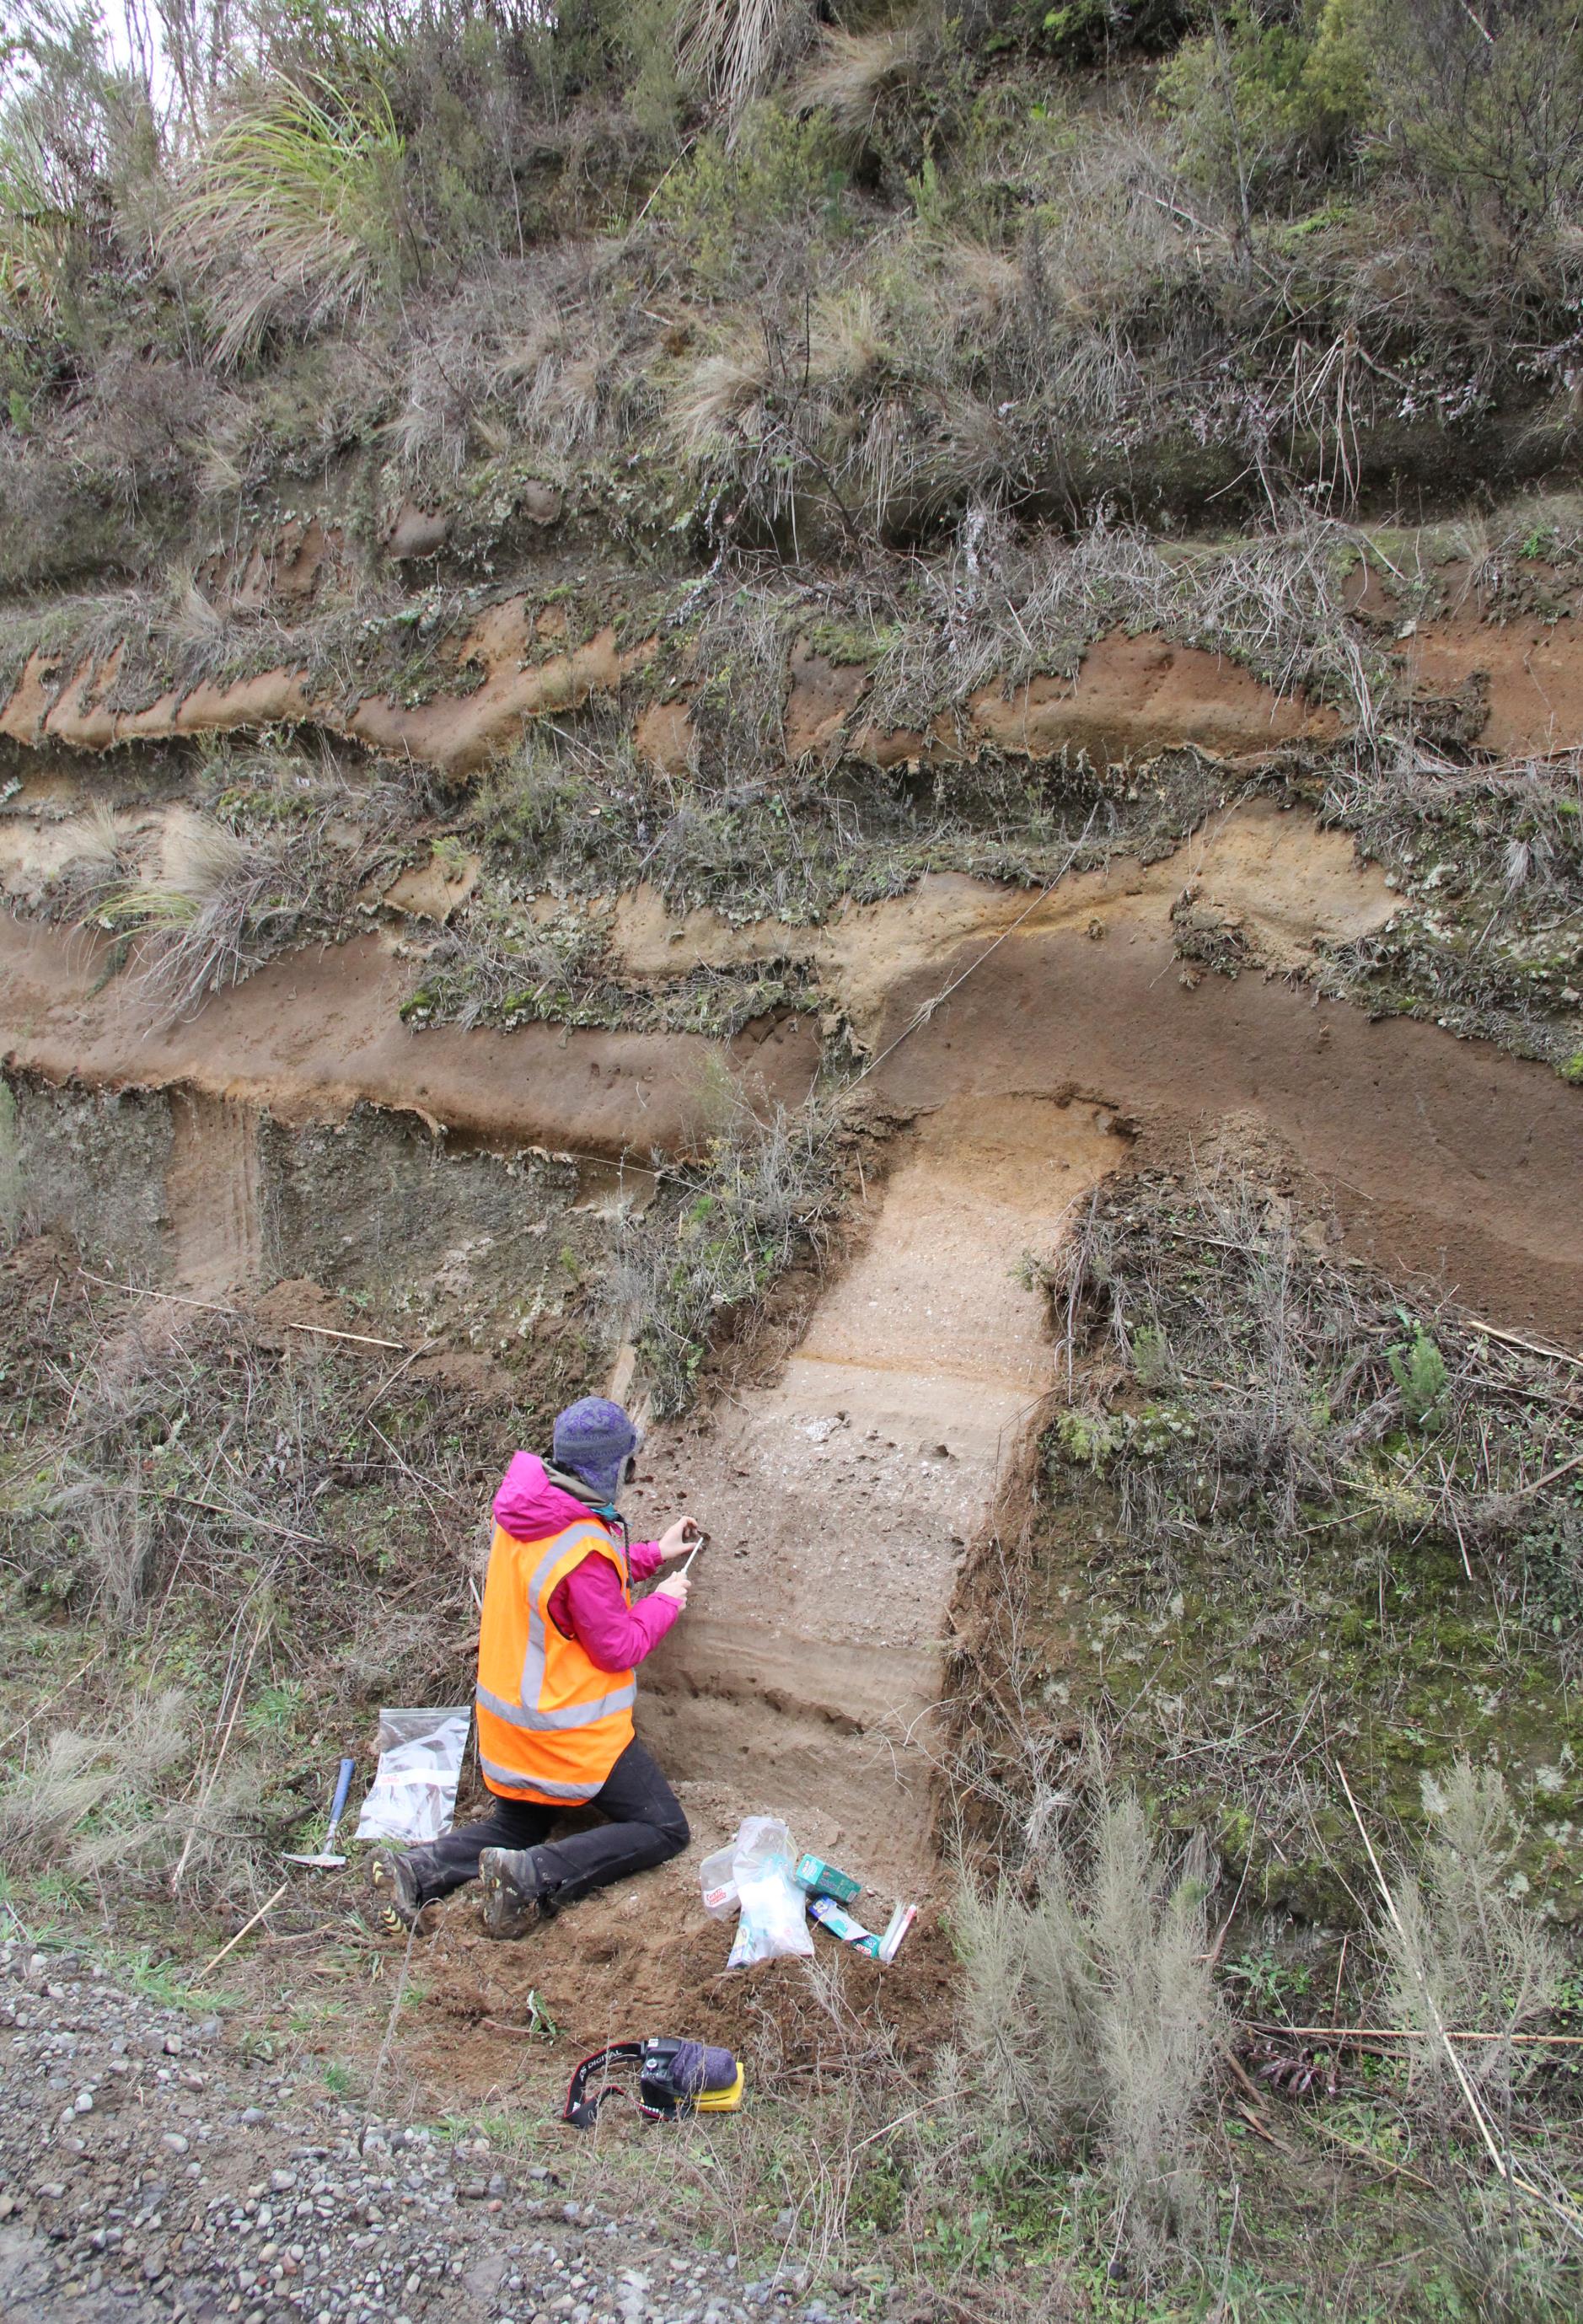
Collecting pumice at an outcrop of the Oruanui supereruption.
To be honest, part of me would be tickled to see a supereruption. But, we should probably all be happy that no one has, given that a supereruption would likely mean pretty bad things for life, both at local and global scales. Just because we haven’t had one, though, doesn’t mean that there won’t be one in the future. Consequently, it’s critical that we study past supereruptions to understand the likelihood and impetus for one happening in the future, as well as for developing effective volcanic hazards and mitigation programs.
That’s where my work, and that of many other volcanic petrologists, comes in. In recent years, my research has primarily been focused on understanding the storage depths and geometry of giant volumes of magma in the crust (how deep are they stored and what shape do they take), their longevity (how long do they sit and accumulate in the crust prior to erupting), and when and why they eventually erupt. To address these questions I look at records of pressure, temperature, and time contained in field relations, geochemistry, and textures (sizes, shapes, positions) of rocks, crystals, melt inclusions, and bubbles. In other words, I use datasets collected at different scales to try and understand the generation, evolution, storage, and eruption of supereruptive magmas.
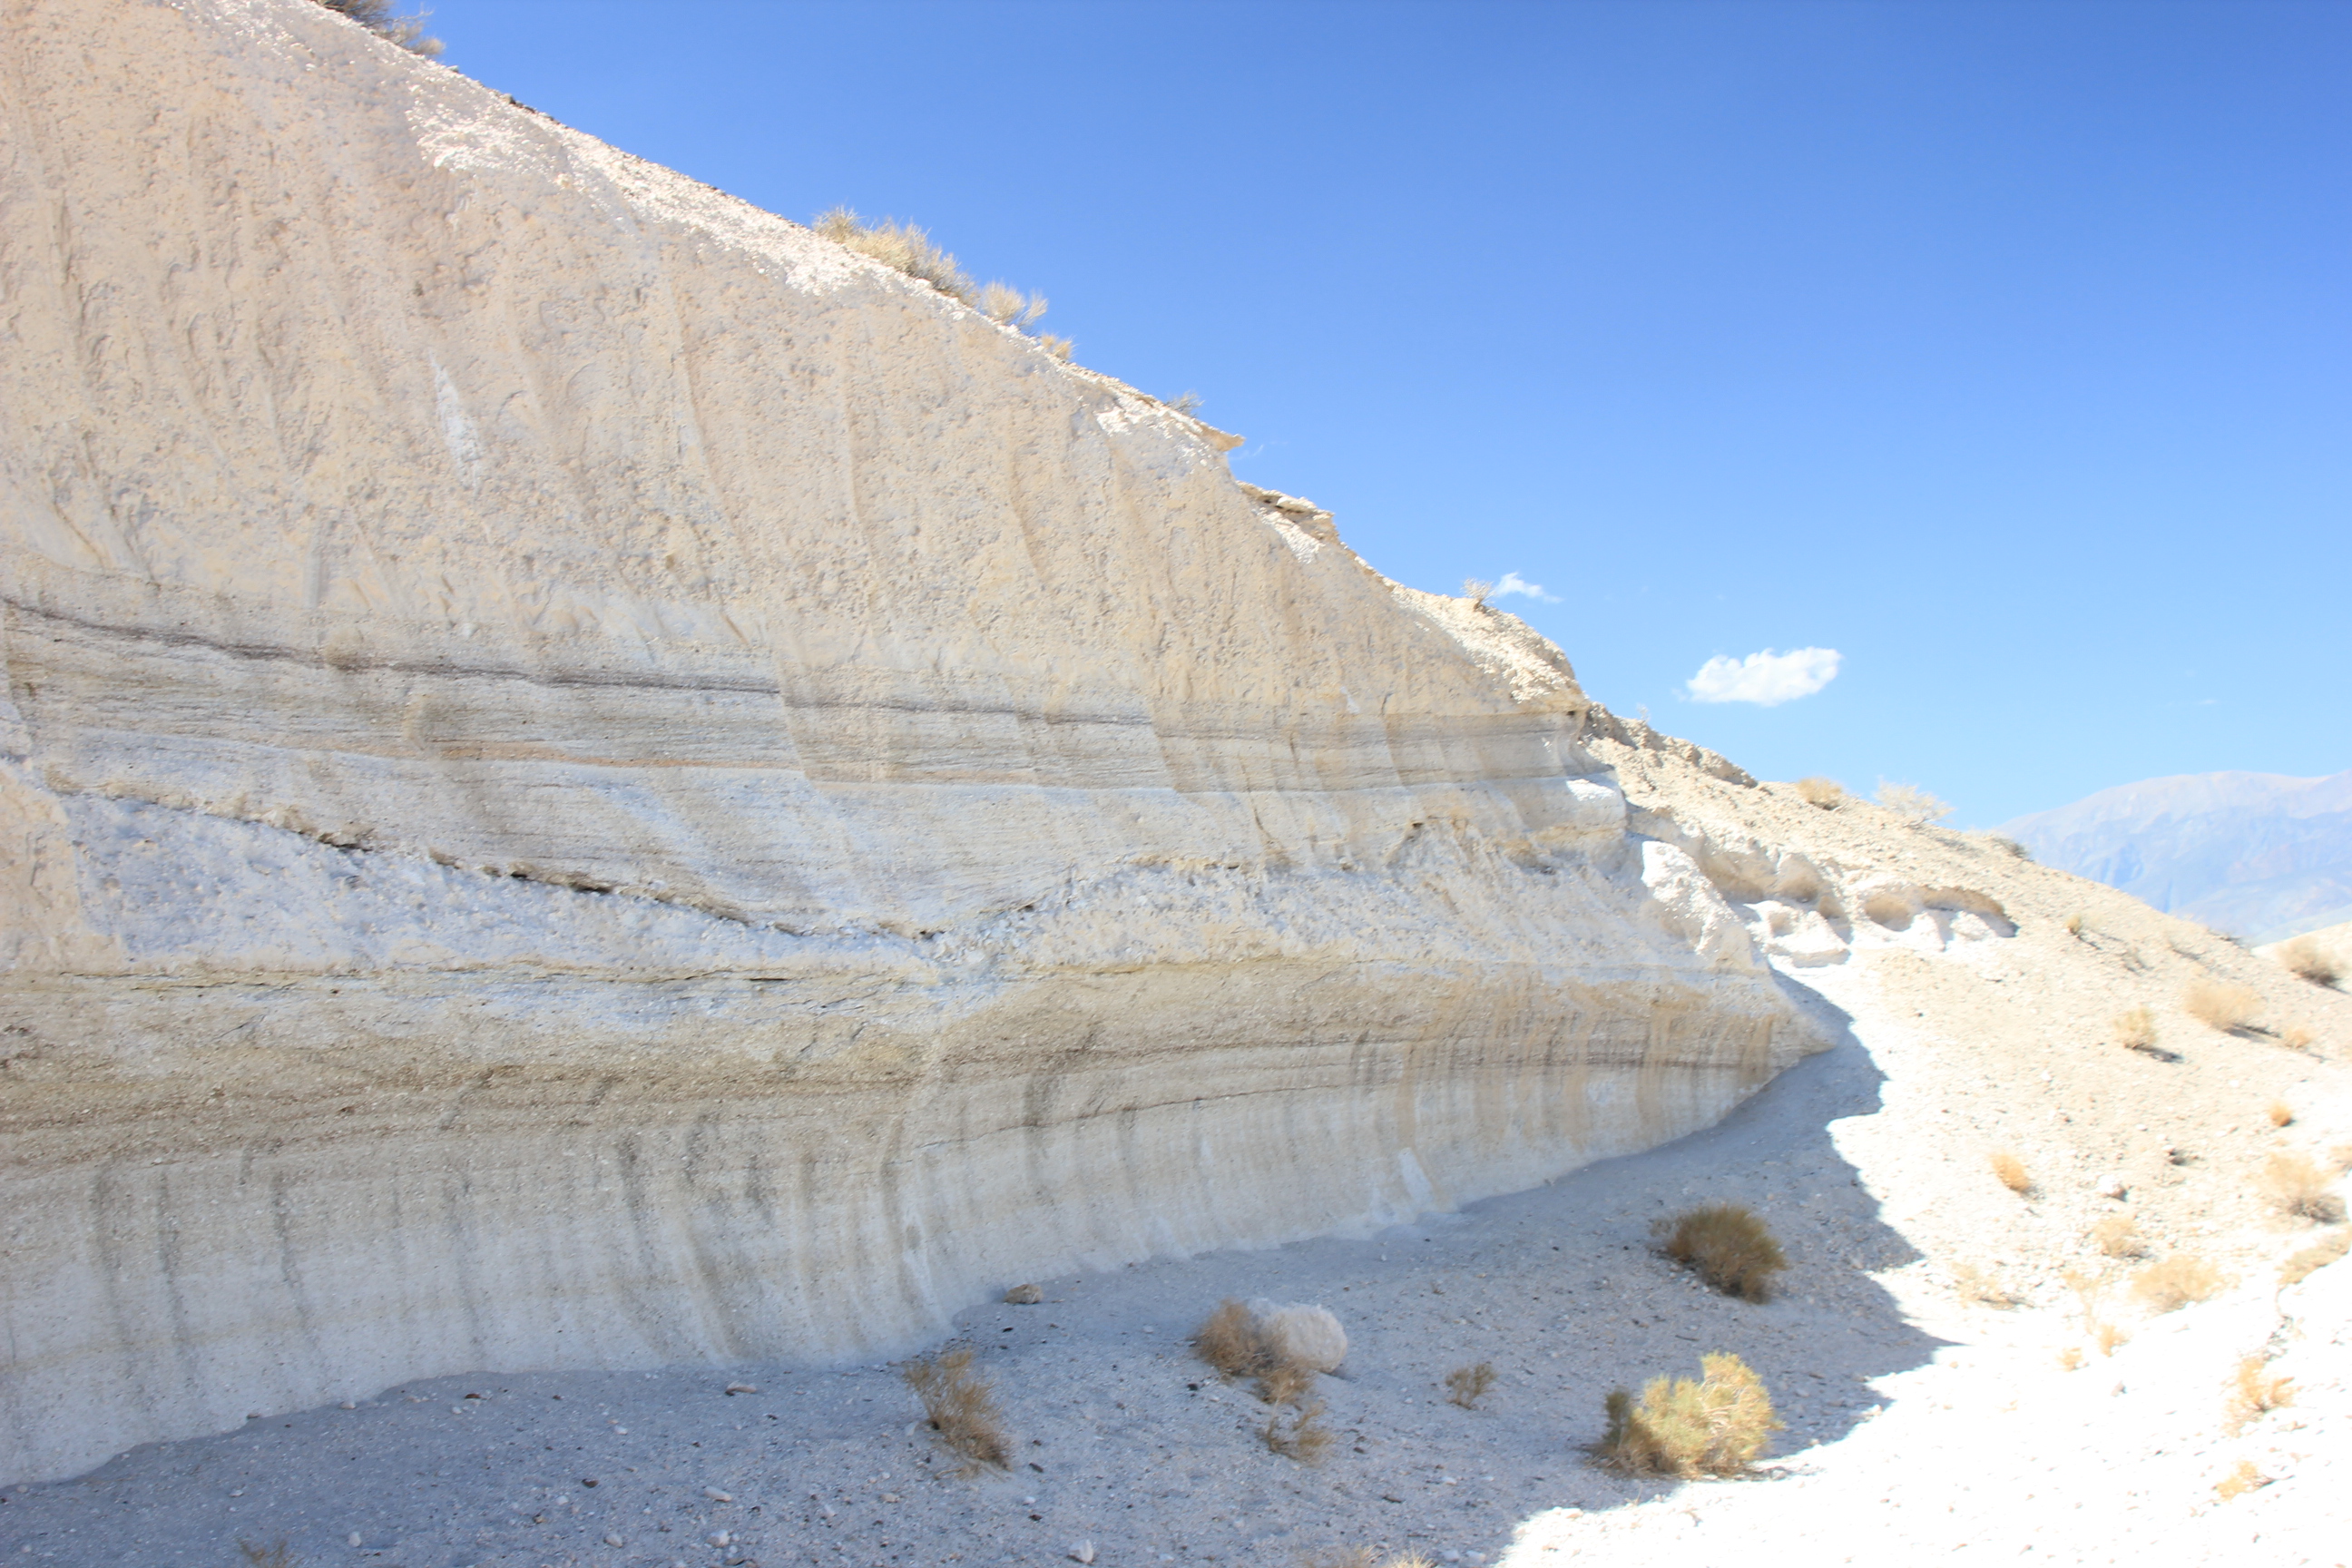
Airfall and ignimbrite deposits of the Bishop Tuff.
For this work I use a lot of pumice, like the stuff used to scour your feet, which is basically a little parcel of magma. Most of my fieldwork is centered on investigating field relations and collecting pumice to take back to the lab and do my analyses on; I have focused on four different field sites/supereruptions: the 767 ka Bishop Tuff (Southeastern California, USA), 18.8 Ma Peach Spring Tuff (Arizona-California-Nevada, USA), 240 ka Ohakuri-Mamaku (Taupo Volcanic Zone, New Zealand), and the 26.5 ka Oruanui (Taupo Volcanic Zone, New Zealand). But, my travels as a geologist don’t stop at fieldwork – many adventures are had delving into the details of the pumice clasts, both in practical terms (the labs I go to for analyses) and philosophical terms (what is revealed in my results).

Finding the Peach Spring Tuff in the Southwest US desert.
One of the big things I’ve been looking at recently has been what the shape of melt inclusions – blebs of crystal-free magma entrapped in crystals – can tell us about time. Interestingly, when sitting at high magmatic temperatures, melt inclusions change shape in a prescribed way. This process, called melt inclusion faceting, is based on diffusion, so it stops at eruption. Consequently, if we can quantify how much shape change a given melt inclusion has undergone then we can also garner information on how long the crystal that contains that melt inclusion sat at high temperatures before erupting – i.e. the longevity of the final melt-rich eruptible magma body.
Over the past few years, I and my co-workers have been developing methods to image melt inclusions in 3D – using 3D x-ray tomography – and quantify the extent to which they are faceted, in order to study this question of longevity. Essentially, we acquire tomographic images of individual quartz crystals and then we use image processing to make polyhedra that are representative of the shapes of individual inclusions. From there, we compare the current shape of a given polyhedron to that of an ellipsoid of the same volume (a representation of the original shape of the inclusion), and we quantify how much shape change has occurred.
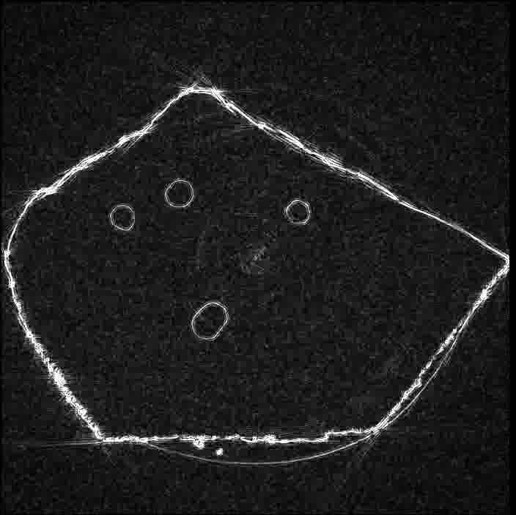
Single tomographic image of quartz crystal with melt inclusions contained inside.
The results are pretty exciting and suggest that giant magma bodies are short-lived in the crust, with final accumulation and eruption of melt-rich magma bodies occurring over timescales of tens to hundreds, maybe a few thousand years! And it’s not just melt inclusion shapes that suggest short timescales – longevity estimates obtained by me and others from compositional zoning in quartz (diffusion chronometry), crystal sizes (crystal size distributions), and radioactive decay of isotopes in zircon (zircon geochronology) are consistent with the melt inclusion results.

Reconstruction of a single melt inclusion (red blob) inside a quartz crystal (gray wireframe).
At first, this might seem pretty terrifying. But, thinking about it a bit more, you might see that the result could actually be quite comforting: such rapid accumulation of giant volumes of magma in the crust should have a physical manifestation at the surface. This means that the pre-eruptive accumulation of these magmas might be something that we can actually detect. If that is the case, then short accumulation times are a benefit to us, giving us reasonable warning and preparation time for an impending supereruption!
To find out more about the results of our melt inclusion study and the imaging method we used, check out these papers:
Pamukcu AS, Gualda GAR, Bégué F, Gravley DM (2015) Melt inclusion shapes: Timekeepers of short-lived giant magma bodies. Geology 43, 947-950.
Pamukcu AS, Gualda GAR, Rivers ML (2013) Quantitative 3D petrography using x-ray tomography 4: Assessing glass inclusion textures with propagation phase-contrast tomography. Geosphere 9, 1704-1713.
![]() This work is licensed under a Creative Commons Attribution-NonCommercial-ShareAlike 4.0 International License.
This work is licensed under a Creative Commons Attribution-NonCommercial-ShareAlike 4.0 International License.