Dr. Simon Cook is a Lecturer in Physical Geography at the School of Science and the Environment, Manchester Metropolitan University (S.J.Cook@mmu.ac.uk). You can follow him on Twitter @glacio_cook.
Life in the Slip Stream, New Zealand: using high-octane data collection to keep up with rapid landscape change
One of the most impressive places I’ve been during my career is the Southern Alps of New Zealand, both in terms of its scenery and the rate of landscape change that occurs here. Geologically, this place is young – the metamorphosed marine mudstones at the summits of the >3000m peaks (the highest being Aoraki/Mt Cook at 3754 m) were below sea level less than 1 million years ago. Today, these mountains experience some of the fastest rates of uplift globally at around 10 mm per year (about the rate your fingernails grow!). Landslides, debris flows and rock avalanches are common in this steep, unstable, and seismically active mountain landscape. That’s all coupled with another extreme: moist air masses that meet the Southern Alps dump metres of precipitation per year (with estimates up to 14m per year!), permitting the existence of glaciers that themselves generate meltwater and prodigious quantities of sediment, which feed impressive braided river systems. So you have to recalibrate your brain to understand New Zealand’s levels of geological and geomorphological activity.
A key area of interest for my colleagues and I over the last few years has been Lake Wakatipu (New Zealand’s third largest lake) and the river systems that feed into its northern end (Figure 1). The rapidity with which Southern Alps landscapes can change was made very clear when, on the 4th January 2014, the mountainside at Slip Stream (Te Korokā) embarked on a drastic post-Christmas weight loss program – a large (greater than a million cubic metres) landslide into the Dart River. This made the news in New Zealand because the landslide partially blocked the Dart River even though it was in flood at the time with a discharge of almost 800 cumecs (cubic metres per second), causing a 4km-long lake to develop almost overnight (Figure 2). Knowing the area, our initial concern was that the lake could burst through the landslide dam, causing destruction to the small communities downstream. Fortunately, the river managed to maintain a path through the landslide debris, and so the lake posed a negligible outburst flood risk. Nonetheless, this event got us thinking.
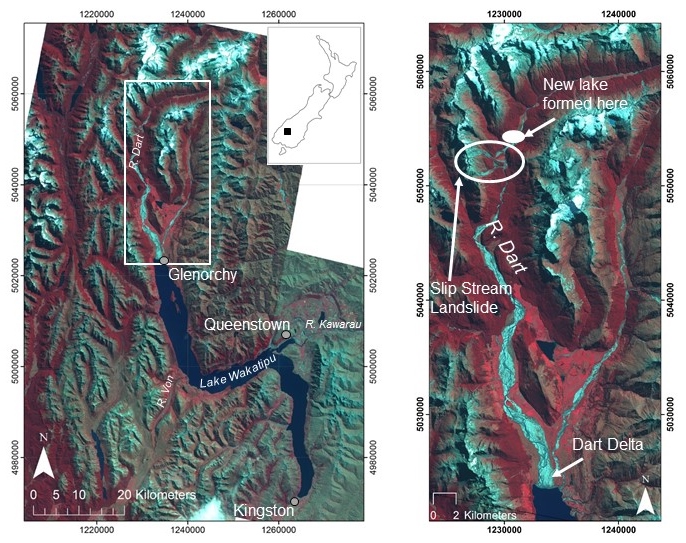
Figure 1: Location of the field area including Lake Wakatipu, the Dart River and the landslide at Slip Stream.
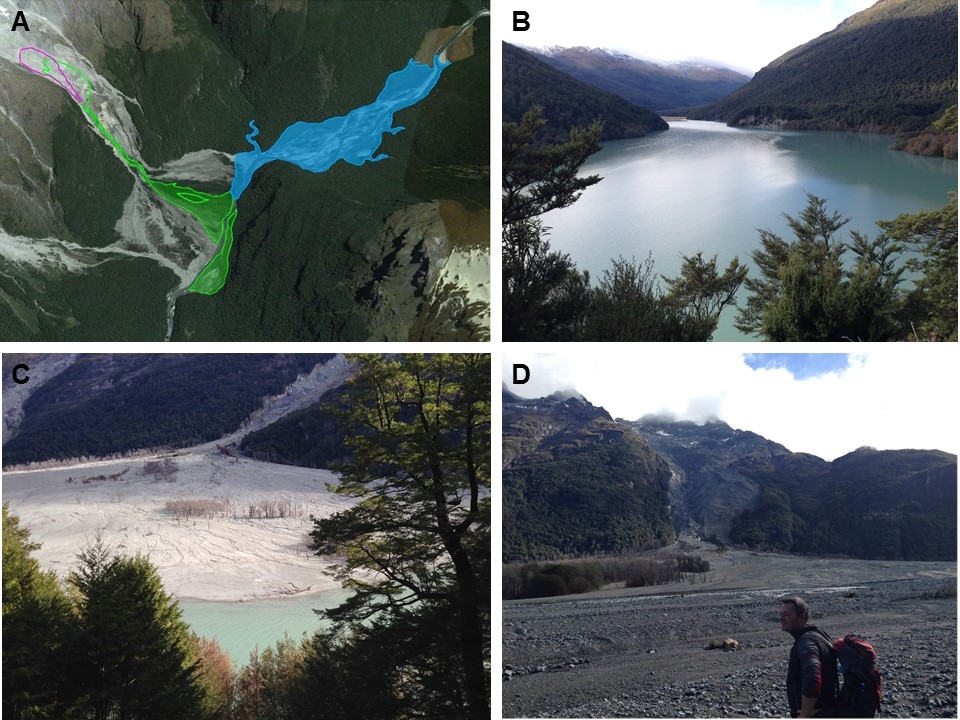
Figure 2: (A) The January 2014 landslide (in green) and the new lake (in blue) formed by partial damming of the Dart River (courtesy of Simon Cox); (B) the new lake; (C) and (D) views of the Slip Stream landslide.
We asked ourselves several key questions:
- How is the river going to move this large, instantaneous input of sediment?
- How does the style of sediment transfer affect flood risk downstream?
- What lessons can we learn about all mountain river systems that experience landslides?
On the one hand, the river might move the sediment downstream as a pulse or wave. On the other hand, maybe the sediment will just disperse gradually from the point of input. There was no clear answer in the literature – indeed, previous studies were in disagreement. But it matters to people which one is correct, because these two styles of sediment transport are likely to cause different rates and magnitudes of river bed aggradation, which affects flood risk. Imagine you lived in a community downstream – would you observe the riverbed building-up over time as the sediment passed through? How quickly would this happen? Would this aggradation effectively elevate the riverbed above the level of your flood protection banks? That wouldn’t be good! Where the Dart River enters Lake Wakatipu, the loss of stream power means that the huge quantities of sediment are deposited as a delta (Figure 3). If this landslide-induced sediment pulse reached the delta and suddenly loaded it, could it cause a delta collapse resulting in a lake tsunami? We also hoped to learn some more general lessons about how Alpine rivers cope with landslide sediment inputs – we have a fantastic natural laboratory where we have caught the landslide in the act!
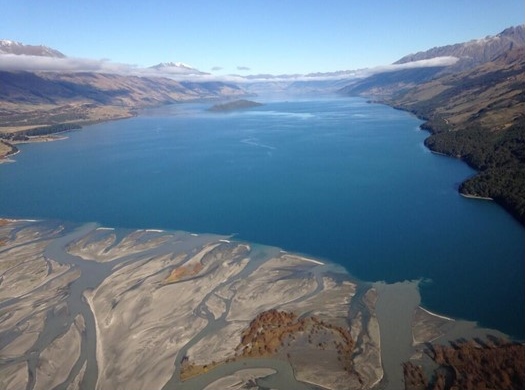
Figure 3: Aerial view of the Dart Delta looking south along Lake Wakatipu (Photo: Niall Lehane).
We had to apply for research funding very quickly in order to get out and survey the river system as soon after the event as possible. We were awarded a NERC (Natural Environment Research Council) Urgency Grant, and so in April 2014, we began an ambitious and high-octane field campaign along the Dart River, stretching from the lake dammed by the Slip Stream landslide, to the Dart Delta at Lake Wakatipu. It’s worth mentioning that this area is probably quite familiar to movie buffs. Fans of the Lord of the Rings trilogy will know the area as Isengard. It also appears in X-Men Origins: Wolverine, masquerading as Canada, where the Wolverine takes shelter in a farm house…which subsequently gets blown up of course!
Anyhow, our primary objective has been to survey the riverbed topography and landslide twice over a 1-year period, and look for changes in that topography that would indicate the passage of sediment downstream from the landslide sediment input. We’ve completed the first survey, and will return in May 2015. However, surveying a ~30 km stretch of river, which in places is up to ~ 1.7 km wide, is a significant logistical challenge. Add to this the relative remoteness of parts of the river, and the solution is clear: we need helicopters and jet boats (take a look at the videos below)!
OK, that sounds like too much fun (and it is), but there is a serious reason for accessing the riverbed in this way. We wanted to use a technique known as ‘Structure from Motion’ (SfM) to build a digital elevation model (DEM) of the riverbed for each of the two surveys. Essentially, this involves stitching together lots of aerial images taken from the helicopter, and using a piece of software that matches common points in the overlapping photos in order to build a 3D model of the riverbed. But photos have no scale or coordinate system, so we had to lay out and survey, using GPS, lots of brightly coloured targets on the ground that could be identified in the images to provide a real-world coordinate framework for our aerial photo survey (Figure 4a-b). These targets have to be spread out across the riverbed in often remote locations – hence, the jet boats and helicopters (Figure 4c-d). We also conducted a laser scan of the landslide, a bathymetric survey of the newly formed lake, and measured the sediment calibre in the river bed and landslide. That’s a lot of work in 2 weeks!
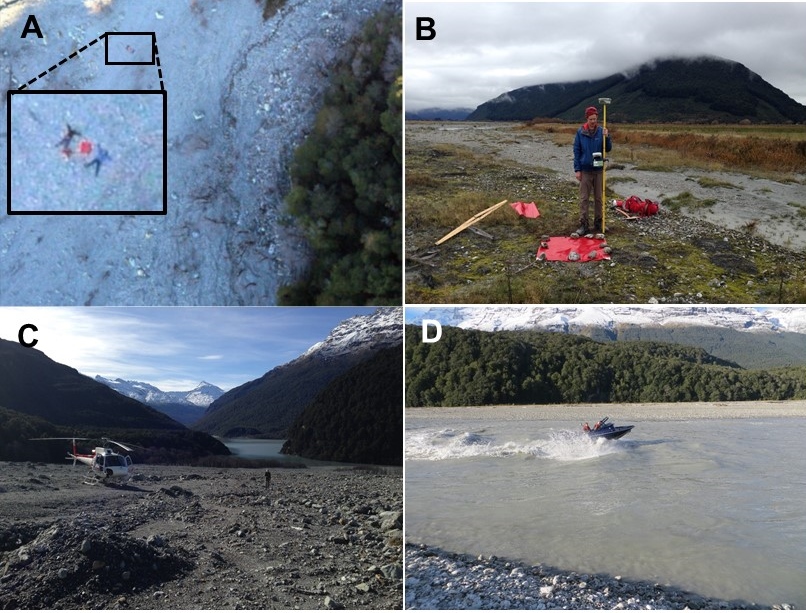
Figure 4: (A) and (B) surveying brightly coloured targets to tie the aerial imagery to real-world coordinates; (C) and (D) Helicopter and jet boat access to remote locations along the study reach.
Apart from the challenges of the science, there are some other issues to deal with. We were plagued by sand flies (Figure 5a) – they live in the river bed and leave an anpoying bite that itches for days to weeks. Hence, the silly head gear. Occasionally, your colleagues lose the plot after a day of Wolman sampling of the river gravel (Figure 5b).
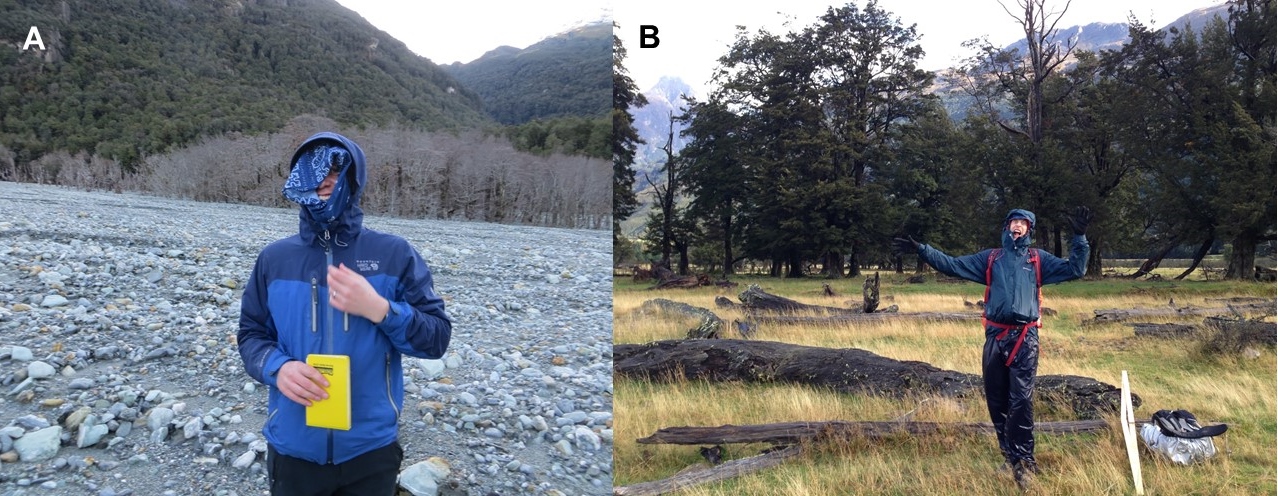
Figure 5: The challenges of fieldwork include sand flies and mad colleagues.
The next stage of our work is to complete the repeat survey in May 2015, after which we’ll be able to build a second DEM of the riverbed and compare that with the previous year (essentially, subtract one from the other). The changes that we detect will inform us about the manner in which the sediment is being moved downstream, and ultimately, help us to answer our research questions. With views like these (Figure 6), we’re looking forward to the return to it!
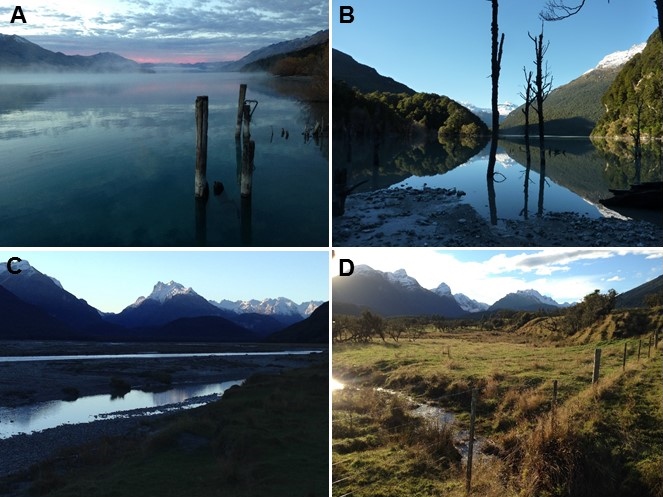
Figure 6: (A) Lake Wakatipu from Kinloch; (B) The new lake at Slip Stream; (C) and (D) the Dart River and surrounding mountains near Paradise…no, seriously, that is the name of the place.
The team:
- James Brasington (Queen Mary University of London [QMUL])
- Simon Cook (Manchester Metropolitan University)
- Simon Cox (GNS Science, Dunedin)
- Joe James (QMUL)
- Niall Lehane (QMUL)
- Sam McColl (Massey University)
- Duncan Quincey (Leeds University)
- Richard Williams (Aberystwyth University)
- Te Rūnanga o Ngāi Tahu team
![]() This work is licensed under a Creative Commons Attribution-NonCommercial-ShareAlike 4.0 International License.
This work is licensed under a Creative Commons Attribution-NonCommercial-ShareAlike 4.0 International License.